Texas McCombs Post-Graduate Certificate Portfolio
Data Analytics Portfolio
Final Project for Data Visualization. Made in Tableau, edited in Adobe Premiere, Canva Pro.

A logistic analysis of the timeless Titanic dataset. The image above is just one key takeaway which demonstrates Age and survival have a non-linear relationship. Click the image to read the whole report.

Linear Regression Analysis using R-studio and R programming language.
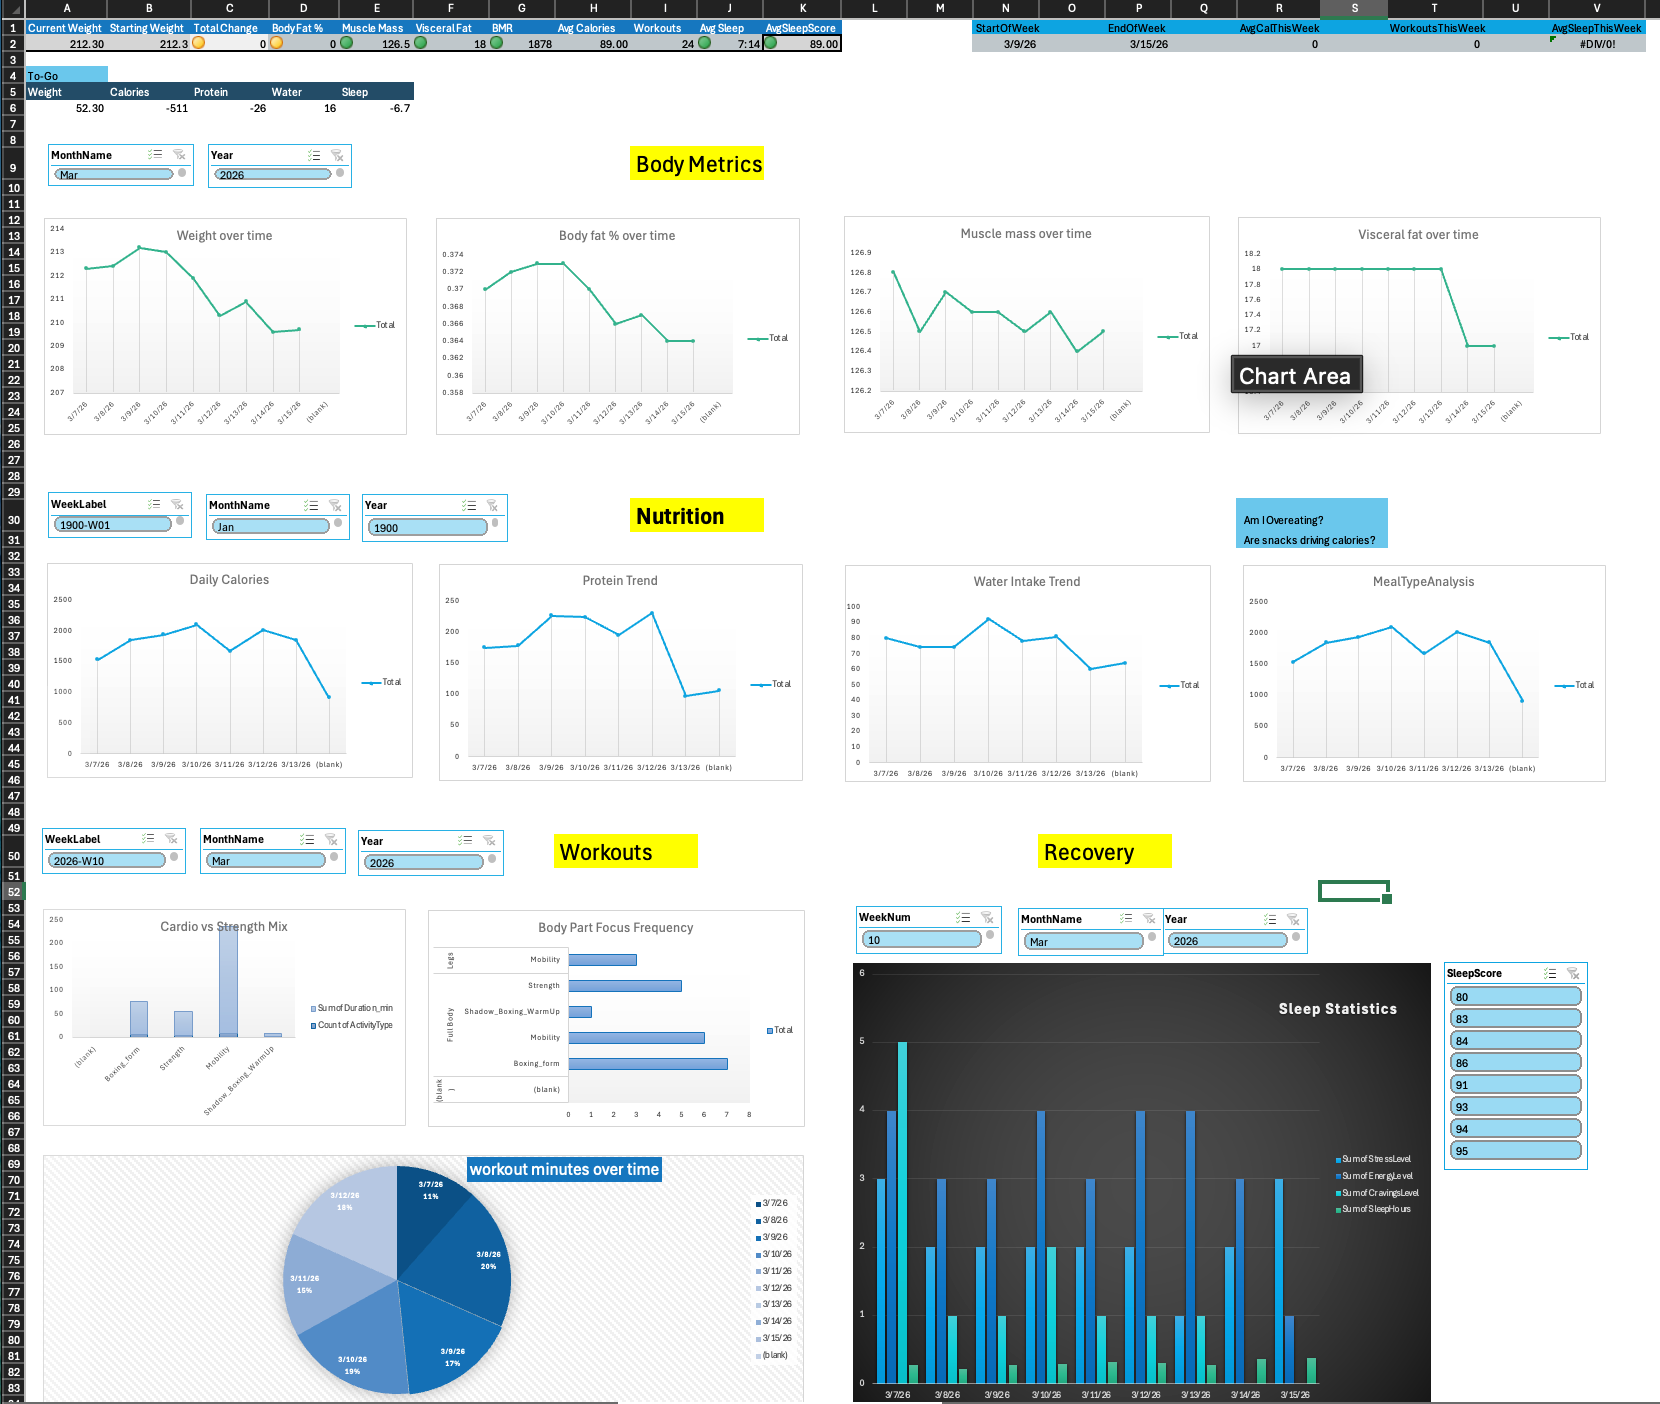
Excel dashboard.
Click the image to go to a interactive page (View Only)
Photo and Video Portfolio
Photography Portfolio Presentation by Ryan Murray